School tax bills arrived in the mail last month, with mine sporting a 5.7 percent increase over last year. That increase motivated me to take a closer look at the numbers.

New York’s $24,040-per-pupil K-12 spending is the highest in the country, nearly double the $12,612 national average, according to the U.S. Census Bureau’s 2018 Annual Survey of School System Finances. Removing New York City’s $26,588-per-pupil tally from the state average leaves the rest of New York at $22,505 per pupil, still highest of any state in the nation by a comfortable margin, Washington, D.C., aside. In fact, while New York has just 5 percent of the nation’s K-12 population, it accounts for fully 10 percent of America’s K-12 educational expenditures.

And yet, in spite of these numbers, every spring New York voters typically approve their local school district budgets, usually by wide margins. A resident who dares to suggest that their district’s expenditures might be a bit excessive will invariably be countered with some version of: “You get what you pay for and New York gets better educational outcomes. I care about our children and their future. I’m willing to invest in them. If you don’t like it, go move to some godforsaken place with cheap, lousy schools.”
OK. Fair enough. But here’s the thing. The numbers don’t support the narrative.
Let’s take a look at the state-by-state SAT scores for the Class of 2020 as supplied by the College Board: The beauty of the SAT is that it provides a standardized comparison benchmark:
| State | K-12 Per Pupil Spending | Median 2019 Household Income | Percent of Students Taking SAT | Class of 2020 Combined SAT Score |
| Colorado | $10,202 | $72,499 | 100 percent | 1012 |
| Connecticut | $20,635 | $87,291 | 100 percent | 1039 |
| Delaware | $15,639 | $74,194 | 100 percent | 978 |
| Florida | $9,346 | $58,368 | 100 percent | 992 |
| Idaho | $7,771 | 65,988 | 100 percent | 984 |
| Michigan | $12,345 | $64,119 | 100 percent | 998 |
| Rhode Island | $16,121 | $70,151 | 100 percent | 990 |
| Illinois | $15,741 | $74,399 | 98 percent | 1007 |
| Maine | $14.145 | $66,546 | 98 percent | 995 |
| West Virginia | $11,334 | $53,706 | 98 percent | 936 |
| New Hampshire | $16,893 | $86,900 | 93 percent | 1055 |
| Maryland | $14,762 | $95,572 | 88 percent | 1029 |
| New Jersey | $20,021 | $87,726 | 82 percent | 1081 |
| Massachusetts | $17,058 | $87,707 | 80 percent | 1119 |
| New York | $24,040 | $71,855 | 79 percent | 1058 |
| Texas | $9,606 | $67,444 | 73 percent | 1010 |
| Washington | $12,995 | $82,454 | 69 percent | 1073 |
| Georgia | $10,810 | $56,628 | 68 percent | 1053 |
| South Carolina | $10,856 | $62,028 | 68 percent | 1026 |
| California | $12,498 | $78,105 | 67 percent | 1049 |
| Pennsylvania | $16,395 | $70,582 | 67 percent | 1078 |
| Virginia | $12,216 | $81,313 | 65 percent | 1116 |
| Indiana | $10,262 | $66,693 | 64 percent | 1074 |
| Vermont | $19,340 | $74,305 | 63 percent | 1103 |
| Hawaii | $15,242 | $88,006 | 51 percent | 1095 |
| Oregon | $11,920 | $74,413 | 51 percent | 1104 |
The table above lists only those states in which at least one-half of the state’s students sat for the SAT. Some states require that 100 percent of their students take the SAT while in other states, only college-bound students sit for the exam. That obviously skews the numbers upward—the best students take the SAT and the worst students don’t. For instance, Kentucky’s average SAT score is 1232 versus New York’s 1064, but only 4 percent of Kentucky’s students take the SAT. All Kentucky high school students are required to take the ACT, which is the test predominantly used by Midwestern colleges and universities. So, the Kentucky SAT sample is limited to higher-performing students applying to East or West Coast universities that require it.
Florida students, on the other hand, averaged only a 992 score. But 100 percent of Florida’s high school students take the SAT, including all those lower-performing kids who would likely skip the exam in a state like New York. That dramatically distorts the comparison. On an apples-to-apples basis, the score discrepancy between New York and Florida would likely be much, much narrower.
When we look at the seven states whose SAT participation rates are similar to New York’s, those falling in the 68 percent to 88 percent range (from Maryland to South Carolina in the table), we see similar student outcomes (an average SAT score of 1056) for dramatically less money (average per-pupil spending of $13,730).
New York’s highest-in-the-nation per pupil spending simply does not translate to materially better student outcomes. Georgia’s students perform roughly in line with New York’s but at half the per pupil cost. Pennsylvania spends 32 percent less per pupil than New York and gets better outcomes. Students in New Jersey, Vermont and Massachusetts all outperform their New York peers.
(I focused on the SAT since only around one-quarter of New York students take the ACT. There is an ACT-to-SAT conversion table, but the ranges are very wide. For example, an ACT score of 24 could equate to anywhere between 1160 and 1199 on the SAT. So, the ACT-centric states are excluded. However, if you have an interest in seeing the ACT state by state comparisons, the numbers are available here.)
Individual student achievement is known to be highly correlated to family income. So, do wealthy states that also achieve superior student outcomes simply buy their success? The correlation coefficient between a state’s median family income and its K-12 per pupil spending is 0.57, so schools in wealthier states do enjoy a resource advantage. But Virginia, which boasts an $81,313 median household income, spends just $12,216 per pupil. Massachusetts, with an $87,707 median household income, spends $17,058 in per pupil. Students in both states comfortably outperformed their New York brethren.
Is New York’s K-12 largess simply a function of our relative wealth versus other states? No. Adjusted for personal income, New York trails only Alaska in terms of income-adjusted educational revenues.

So, if it isn’t yielding better student outcomes, why does New York’s K-12 education cost so much?
Well, one reason is New York’s outsized growth in the number of special education students, which, according to the state Education Department, average $32,359 per pupil in direct education expenditures versus $13,367 for a general education student. U.S. Census Bureau and state Education Department data show that from 2000 to 2018, New York’s K-12 special education population rose 20 percent, from 406,841 to 489,491 students, while the state’s total K-12 population declined 17 percent, from 3.5 million children to 2.9 million. As a result, the percentage of New York’s K-12 population classified as special education rose from 11.4 percent in 2000 to 16.5 percent in 2018. By comparison, the Pew Research Center estimates that 14 percent of national K-12 students were classified special education in 2017-2018.
A second reason is New York’s teacher salaries, which averaged $85,889 during the 2018-2019 school year versus $61,730 nationally, according to the National Center for Education Statistics. High-cost downstate districts, such as those in Westchester and Rockland counties, materially skew the statewide mean above the levels found in Upstate districts. But that $85,889 mean has risen 68 percent since the 1999-2000 school year, a 12 percent increase in inflation-adjusted dollars. The national mean rose just 48 percent and has actually declined 1 percent on an inflation-adjusted basis since 1999-2000.
Staffing levels represent a third contributing factor. According to the National Education Association, New York’s average student/teacher ratio is just 12.3 to 1, well below the national average of 15.7 to 1. Only Missouri, New Hampshire, New Jersey and Vermont have staffing levels below New York’s. Employing 28 percent more faculty per pupil is expensive.
But student/teacher ratios only tell part of the story. Support staff also contribute a significant cost factor. Here are the 2018-2019 staffing numbers for Monroe County’s 18 school districts as compiled by the state Education Department:

The true student/staff ratios may very well be even lower than what appear in the above table. One school district human resource officer confided to me that the numbers they submit to the Education Department do not include “our food service, bus driver and maintenance staff.”
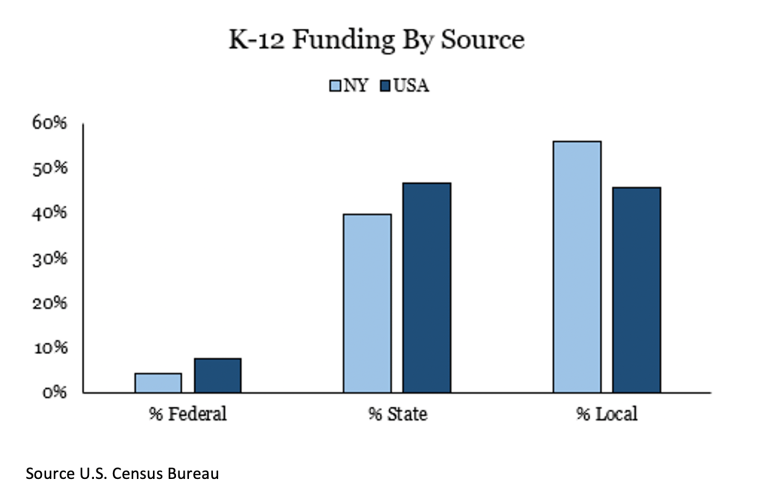
There is more to the property tax calculus than just aggregate expenditures. New York is also differentiated by where the money comes from. Because New York is a relatively wealthy state and because we spend so much per pupil, only 4.3 percent of New York’s K-12 funding flows from the federal government, whereas nationally the average is 7.7 percent. Despite that lower federal share, state government in New York only absorbs 39.6 percent of the total expenditure burden versus a 46.7 percent average elsewhere. That leaves a disproportionate share of New York’s total K-12 cost to be funded with local property taxes.
All of that said, I do agree that high-quality public schools constitute an essential building block for local economic prosperity. So, here is a question you might want to pose to your local school district’s leadership:
“Every year you publish a brochure highlighting the wonderful colleges and universities into which our graduating seniors are accepted while noting the percentage of our graduates who transition on to college. But you never disclose the percentage of our college-bound students who successfully graduate from college. Why not? College preparedness isn’t measured by college admittance, it is measured by college success. The benchmark shouldn’t be how many of our seniors enter college, it should be how many of those who choose to enter college go on to graduate and do so on schedule.
College outcomes data is readily available. For a pittance, the National Student Clearinghouse will provide our district with a report showing the college completion (and college persistence) numbers for our last eight graduating classes. If our district’s educational quality is as excellent as your publications contend, then why isn’t college completion and success as prominently displayed in our publications as is college entrance?”
See what answer you get.
Geoff Rosenberger is board chair of Rochester Prep Charter Schools and managing member, Lily Pond Ventures LLC.
Thanks, Geoff, for putting numbers behind what most New York taxpayers intuitively know; NYS schools cost way too much per pupil. I’ll take it another step and say the primary culprit for our over-priced and underperforming schools are the teacher unions. As you also point out, the cost of “educating” special ed students is particularly high. Although the burden that these kids and their parents bear, through no fault of their own, is particularly harsh I’m not sure that investing that much money on those who will never be able to fully integrate and contribute to society does them, or society as a whole, a true service. I wish I could offer an alternative that would still allow these kids to live with dignity and grace but I can’t. We owe it to them and ourselves to find a better approach for those who need an extra leg up.
SAT scores are used here and make little sense as a measurement. That exam is going by the wayside as a college admissions tool. Passé sooner than later and researching why and the problems with standardized testing as a tool is another article. Using non-classroom staff as a support staff stat to measure educational outcomes is disturbing. Interesting additional info would be cost per student for bussing to and from school. Info on total cost of sports offerings and programs with the expense of coaches, busses, facilities and maintenance, rentals – like bowling alleys and ice time, security at events and compare that state-to-state. Not against it, but knowing the cost is being informed. This is part of per pupil costs and not used by every student. New bowling team added in a district I lived in was a $17,000 line item. That was in the 1990s. Again just stats. College success after leaving is not a public school responsibility. Stats are now collected at the federal level to show how long it takes college/university students to graduate and how many drop out. That info is higher ed’s stat. It is upon the student to take on the responsibilities of higher ed. Also not all students go to college. 50 states plus DC, Puerto Rico and Guam (maybe others that I’ve missed) make up the USA amazing variables. The county wide districts in some states vs 17-18 districts in Monroe County – so many variables. Therefore, many stats and a lot of info to be used in many ways. Stats are intriguing things and can be used in many ways. And yes I believe the per pupil cost for NYS.